
Running on Node.js
Use the same chart configuration and data-loading code in a browser application and on the server. A Node.js job can draw the same signal, scales, and custom Marks without recreating them in a separate charting library. Only the target and environment-specific acquisition need to differ.
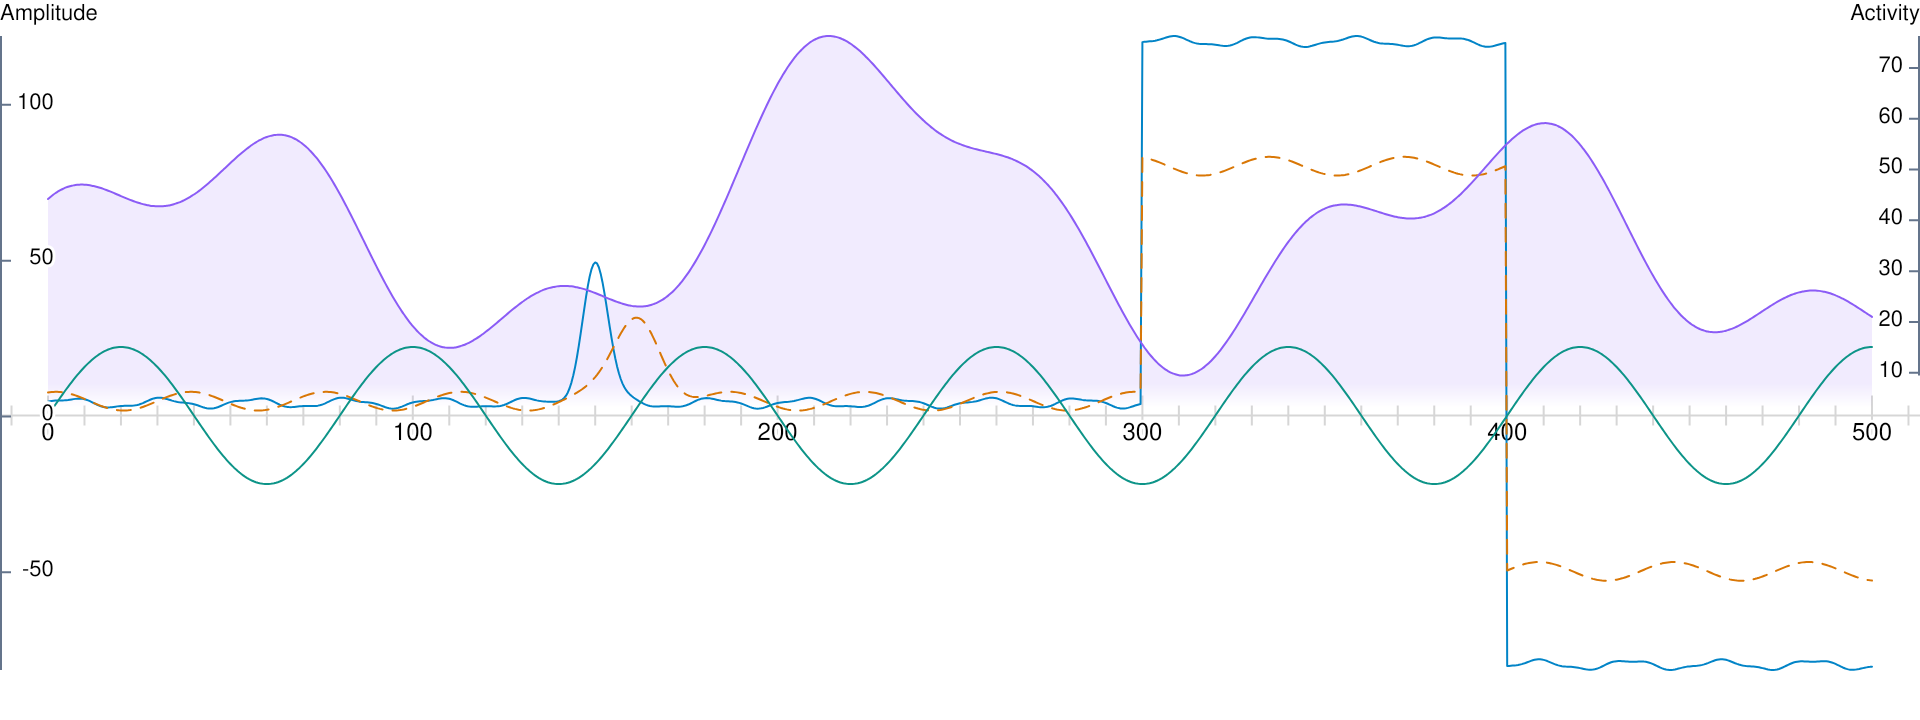
This PNG reuses the Multiple Series example's data and chart configuration. It is rendered on Node.js with cursor: false and each Series' tooltip: false, against a white background. The image is rendered at twice its 960 × 360 layout size for sharp labels.
Share chart configuration and loaders
Keep the chart and loader in an environment-independent module. This example accepts an absolute data URL so the same acquisition code works in both environments:
// chart.ts
import { createDataLoader, defineTimescopeOptions } from 'timescope';

export function createChartOptions(dataUrl: string) {
  const loader = createDataLoader({
    chunked: false,
    loader: async () => {
      const response = await fetch(dataUrl);
      if (!response.ok) throw new Error(`Measurements: ${response.status}`);
      return response.json();
    },
  });

  return defineTimescopeOptions({
    sources: { measurements: { loader, chunked: false } },
    series: {
      temperature: {
        data: { source: 'measurements', color: '#0d9488', domain: { axis: 'left', unit: '°C' } },
        chart: 'lines',
      },
    },
    tracks: { default: { timeAxis: { relative: true } } },
  });
}
The endpoint returns rows such as { time: 15, value: 21 }. An existing range loader can be shared in the same way; see Chunk Loading. Loader code must be usable in its target environment: pass in URLs, credentials, or application services rather than reading browser globals inside the shared module.
In the browser, create the chart with a DOM target whose height is set by CSS:
import { Timescope } from 'timescope';
import { createChartOptions } from './chart';

const timescope = new Timescope({
  ...createChartOptions(new URL('/samples.json', window.location.href).href),
  target: '#chart',
  fit: [0, 60],
});
Render on the server
Install the Node.js canvas implementation:
npm install timescope skia-canvasSupply a Canvas from skia-canvas and use the shared options. Here the finished canvas is saved as an image for a report:
import { Canvas } from 'skia-canvas';
import { Timescope } from 'timescope';
import { createChartOptions } from './chart';

const canvas = new Canvas(800, 240);
const timescope = new Timescope({
  ...createChartOptions('https://example.com/samples.json'),
  target: canvas,
  backend: 'skia-canvas',
  fit: [0, 60],
});

try {
  await timescope.nextFrame(); // Let initial sizing and fit finish.
  await timescope.prepareView().fetch();
  await timescope.nextFrame();
  await canvas.toFile('chart.png');
} finally {
  timescope.dispose();
}
Replace the URL with your service's endpoint. The chart settings and loader are shared code; each environment creates its own runtime instances. Timescope retains a supplied canvas when disposed, so the application still owns the result.
Wait for data and drawing
A prepared view acquires the data required for a particular time and zoom. After construction, first await nextFrame() so initial sizing and fit have been applied, as in the example above. On that mounted chart, fetch() loads the requested view and activates it; a subsequent nextFrame() waits for drawing to finish:
await timescope.prepareView().fetch();
await timescope.nextFrame();
This sequence works in both environments. Mount events only indicate a drawable canvas, and reload() only requests a refresh; neither means that replacement data has been drawn.
To produce a different view of the same chart, set its time and zoom on the prepared view before fetching:
const view = timescope.prepareView();
view.setTime(30, false);
view.setZoom(4, false);
await view.fetch();
await timescope.nextFrame();
Keep the clock, canvas size, and configuration stable while fetching. Navigation, resizing, option changes, or unmounting cancel an active fetch with AbortError; acquisition failures also reject it. Use a fixed time or a fitted range for a reproducible server render. Prepared-view API
Set the output appearance
Set a supplied canvas's size with await timescope.resize(width, height, dpr) when needed; dpr defaults to 1. Resize before fetching and drawing the final view.
The canvas is transparent. A browser container's CSS background is not part of its pixels, and Node.js has no host CSS color to inherit. Set axis label colors explicitly when needed, and composite a background in your canvas workflow if the output requires one.
Use the same chart font styles in either environment, with the fonts available to that environment. The browser's fonts loading option is ignored by Skia Canvas. See Styling for font selection and constructor options for environment-specific settings.